
Guide to Data Onboarding for WattCarbon Users
WattCarbon provides measurement and verification (M&V), an asset registry, and a system of record for tracking EAC (Energy Attribute Certificate) ownership. EACs reflect the environmental and economic externalities associated with energy projects, in particular the reduction of carbon emissions.
To accurately credit environmental impacts, WattCarbon runs M&V on each energy project. M&V requires proof of impact — meter data from the project that substantiates the carbon-reduction claim. This guide covers the two ways to get that data onto the platform.
Basic Terminology
Section titled “Basic Terminology”EAC — Energy Attribute Certificate. The unit WattCarbon mints to represent a verified hour of carbon reduction.
Asset — The physical energy intervention that produces EACs: a solar installation, battery, demand-response site, or building that underwent an energy-efficiency upgrade. An asset holds project metadata like location and meter references.
Meter — A timeseries data source attached to an asset. An asset can have one or more meters (electricity, gas, etc.).
Methodology — The M&V approach used to calculate hourly savings for an asset. Each asset has one or more methodologies, following OpenEAC Alliance approved standards. The primary methodology drives top-level summary calculations, grid and carbon scores, and EAC minting.
Minting — The process of creating EACs ex post, once actual energy savings have been calculated from a deployed asset.
See the FAQ for answers to common terminology questions.
Choosing a path
Section titled “Choosing a path”There are two ways to get data onto the platform:
| Method | Best for |
|---|---|
| Web app upload wizard | One-off or batch CSV uploads, manual workflows, exploring the platform. Auto-detects assets and meters from a single file. |
| WattCarbon API | Programmatic / automated ingestion, integrations with your own systems, large-scale or recurring uploads. |
The web-app wizard and the API write into the same data model — assets and meters created either way are equivalent. Most customers use both: the wizard for initial exploration, the API for ongoing ingestion.
If you already use one of WattCarbon’s data-provider integrations (Arcadia, Bayou Energy, UtilityAPI, Enphase, etc.), you can skip both methods — see Connect data in the left nav to set up a provider connection that pulls meter data automatically.
Part 1 — Onboarding via the web app
Section titled “Part 1 — Onboarding via the web app”The web app’s upload wizard takes a CSV or Excel file, analyzes its structure, suggests column mappings, and creates assets, meters, and timeseries data in one flow.
Prerequisites
Section titled “Prerequisites”- An active WattCarbon account
- A CSV or Excel file (.xlsx) containing your meter readings, up to 20 MB
- At minimum: a timestamp column and a value column (e.g. kWh). Address columns are optional but enable automatic asset creation.
Step 1 — Open the upload wizard
Section titled “Step 1 — Open the upload wizard”From the Meters page, click the Upload data button in the top right. (You can also reach the wizard at /upload.)
If you’re connecting data for the first time and prefer a provider integration, click Connect data in the left nav instead — that flow offers manual upload as a fallback.
Step 2 — Upload your file
Section titled “Step 2 — Upload your file”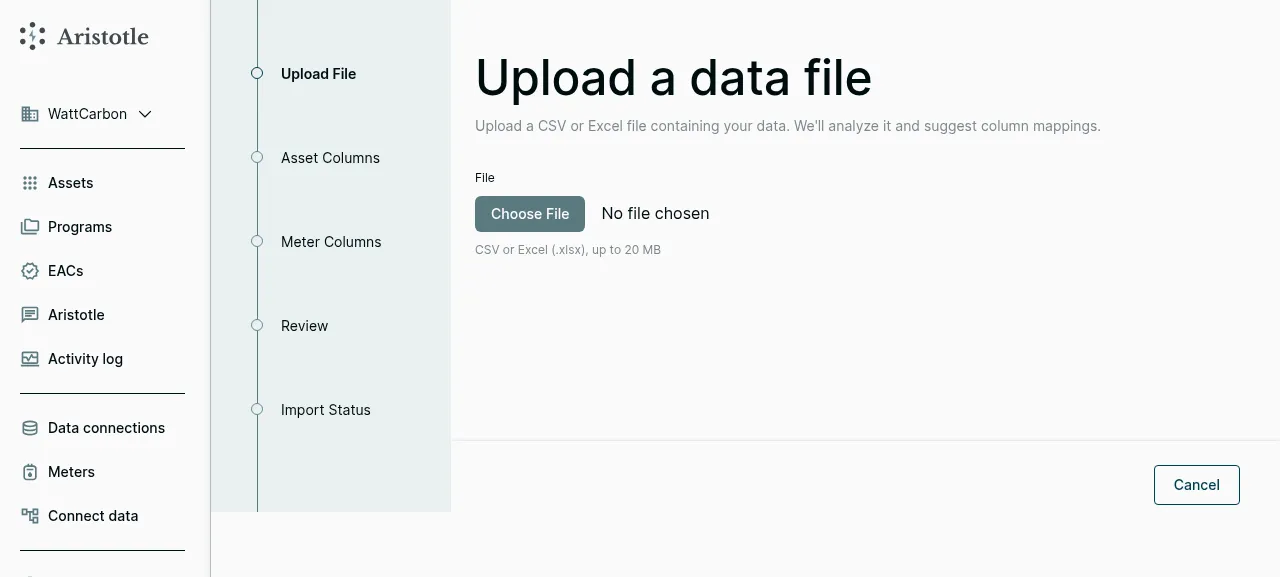
Drag and drop your CSV/Excel file, or click Choose File to browse. The wizard accepts CSV and Excel (.xlsx) up to 20 MB. As soon as the file is selected, WattCarbon analyzes its structure and advances you to the next step.
Step 3 — Confirm asset column mappings
Section titled “Step 3 — Confirm asset column mappings”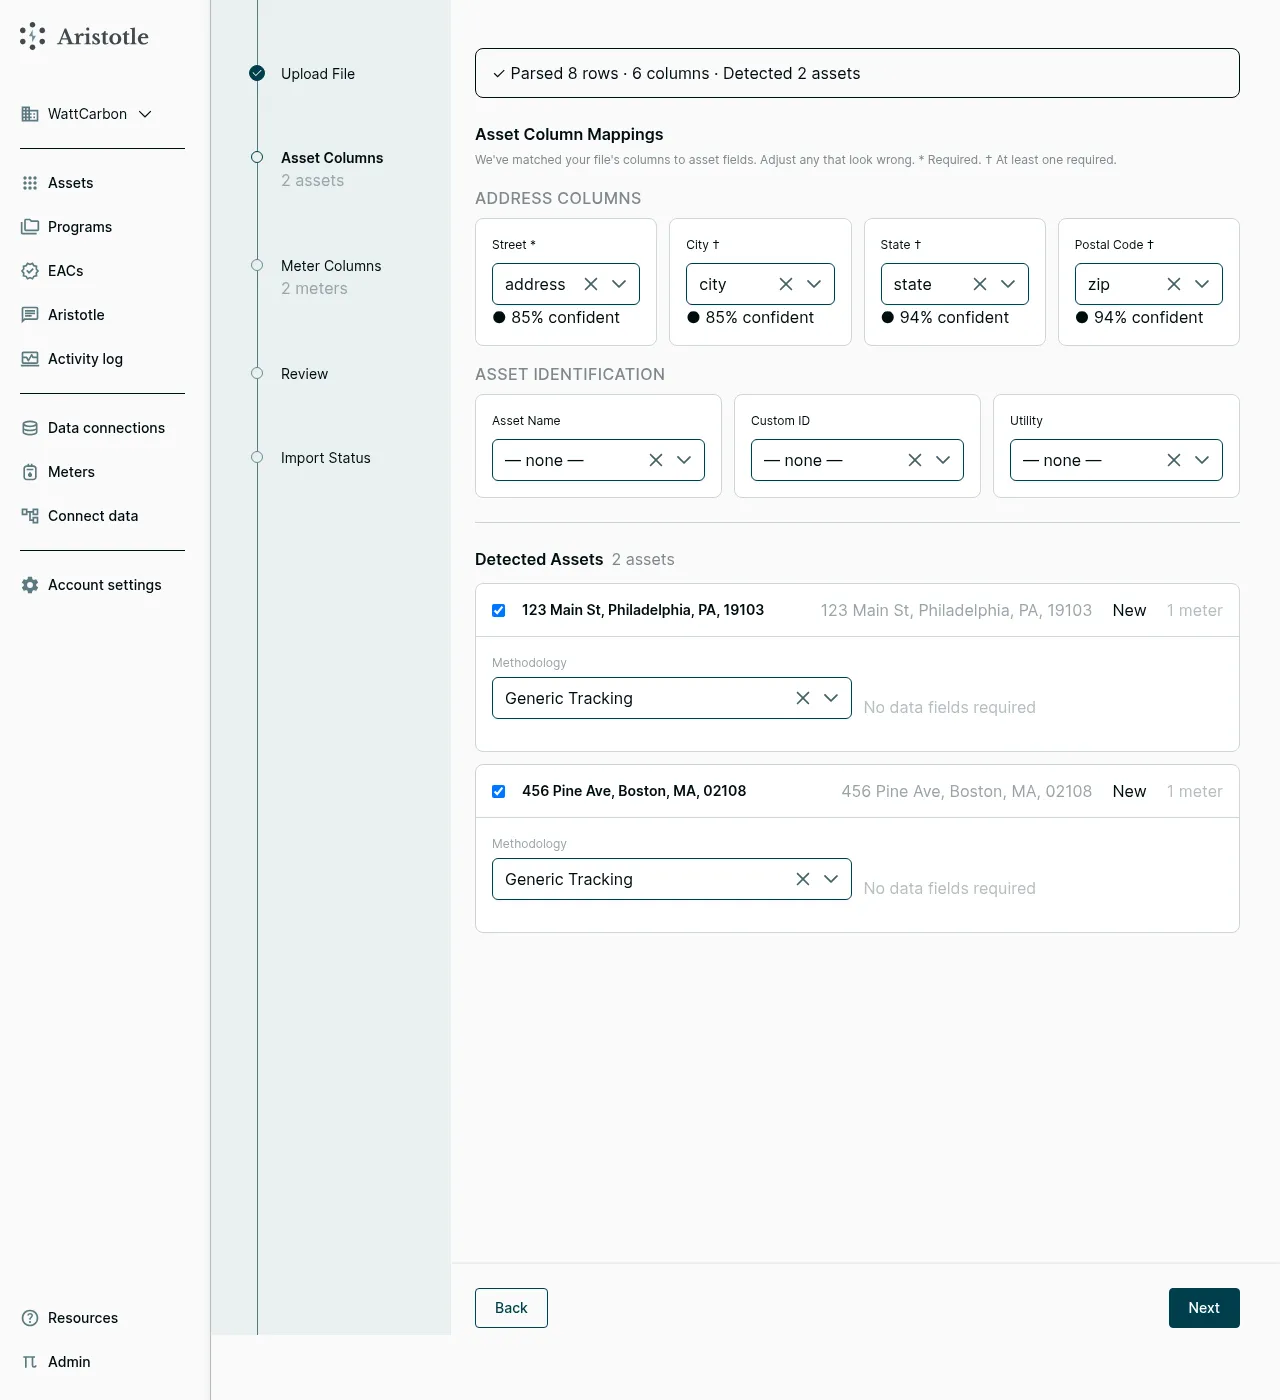
If your file includes location information, the wizard detects asset groupings and proposes column mappings. The header banner shows what was found — e.g. “Parsed 8 rows · 6 columns · Detected 2 assets.”
Address Columns — Street, City, State, and Postal Code are mapped from columns in your file. Each suggested mapping shows a confidence score so you can see how certain the auto-detection was; click a dropdown to override.
Asset Identification — Optional fields for Asset Name, Custom ID, and Utility. If you have a unique site identifier in your file, mapping it as Custom ID prevents duplicate assets on re-upload.
Detected assets — Each unique location becomes a proposed asset. For each one, pick a methodology from the dropdown. The default is Generic Tracking (no modeled baseline — pass-through metered data); other kinds include Directly Measured Solar, Storage, Building (EE + Electrification), and others. Some methodology kinds require additional fields; the wizard prompts for any that are needed.
If a row shouldn’t become an asset, uncheck it.
If your file has no address columns, the wizard skips this step and goes straight to meter mapping — you’ll create meters without auto-creating assets.
Step 4 — Confirm meter column mappings
Section titled “Step 4 — Confirm meter column mappings”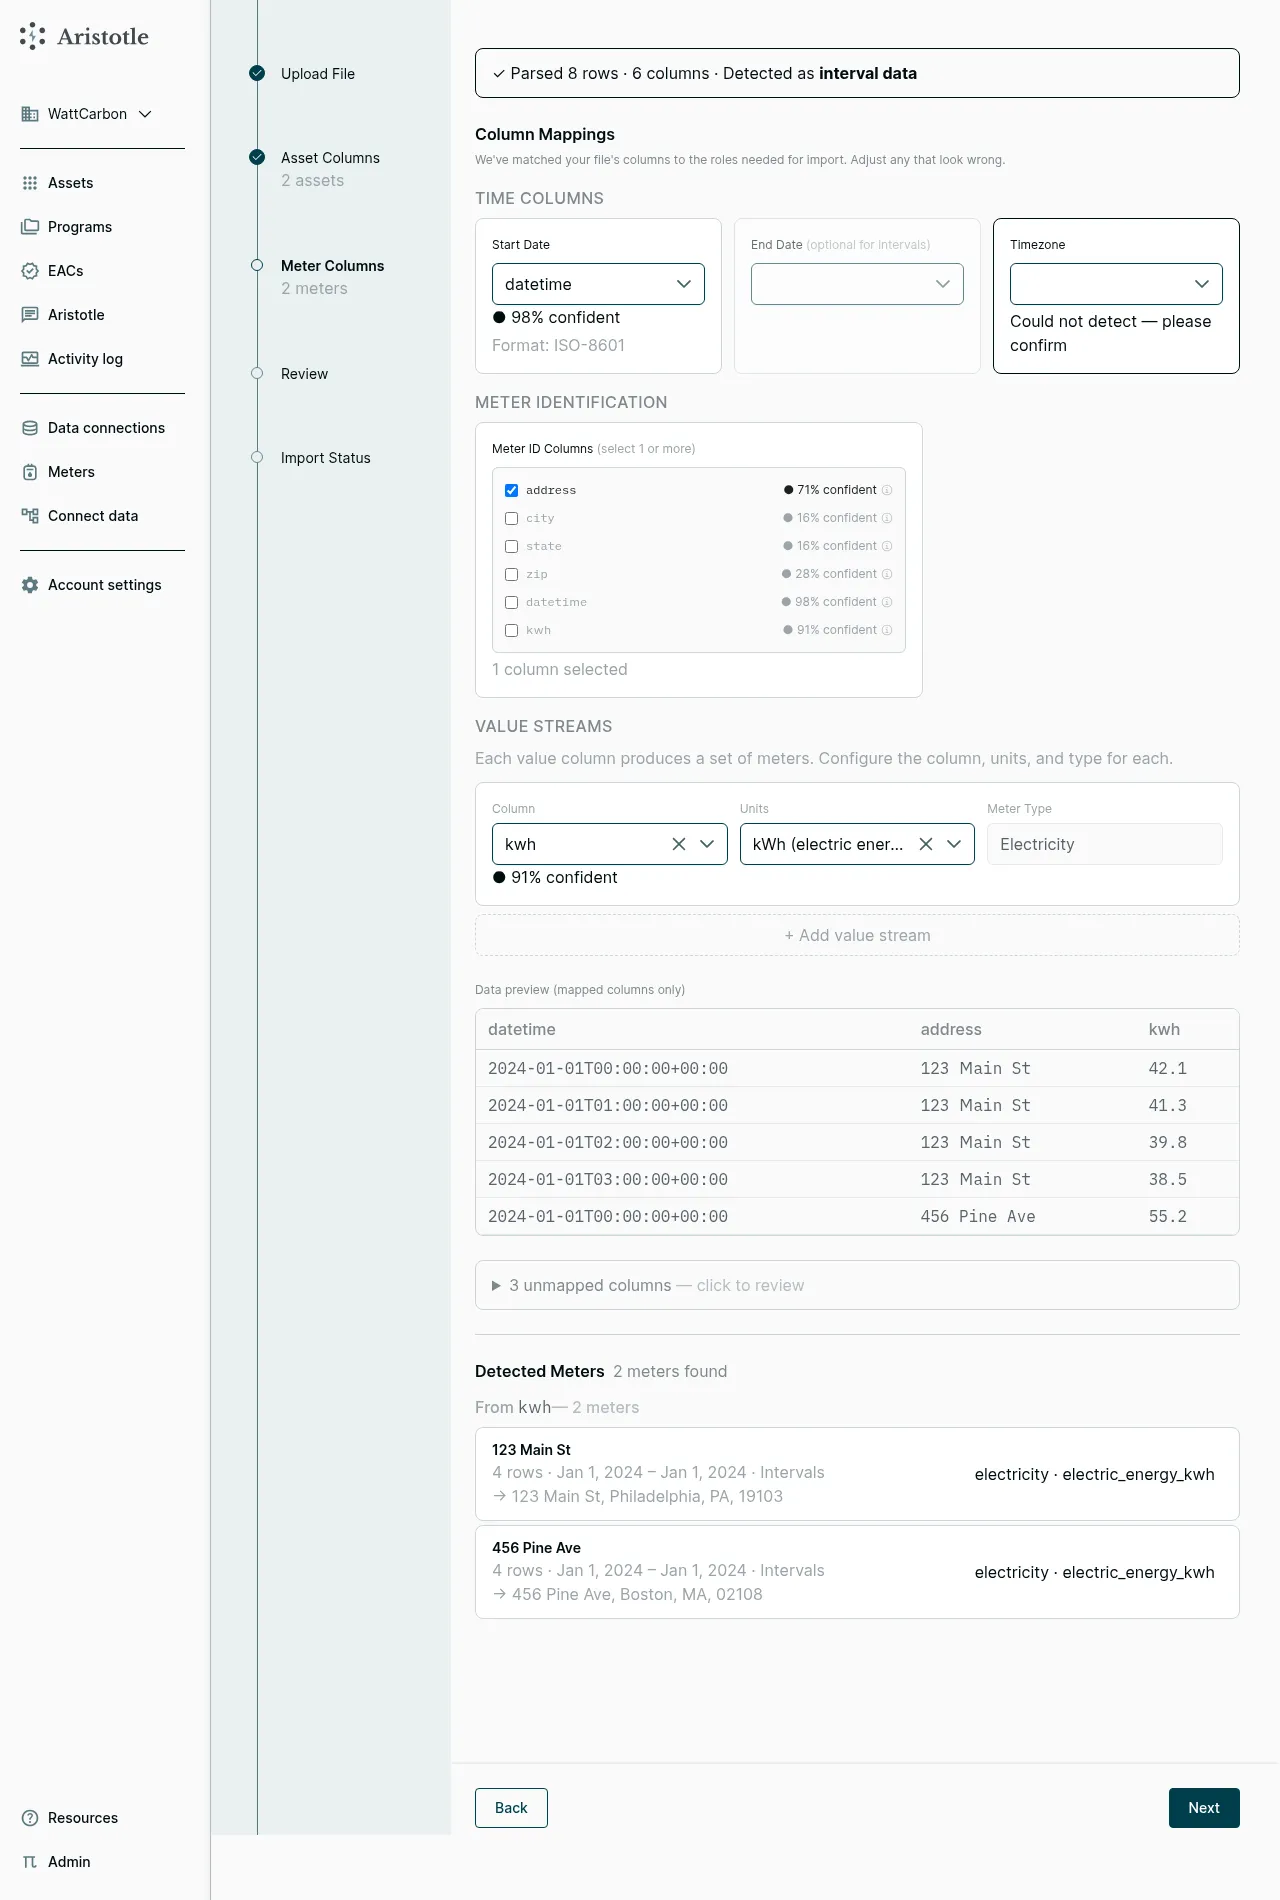
Time Columns — The wizard auto-detects timestamp columns. For interval data, you map a single Start Date column. For billing data, you map a Start Date and an End Date. If timestamps are not timezone-aware, you’ll need to confirm a timezone.
Meter Identification — Pick the columns that uniquely identify each meter. If your file contains multiple meters per file (e.g. one row per (address, timestamp)), check the columns that distinguish them. The wizard shows confidence scores here too.
Value Streams — Map each value column (kwh, therms, etc.) to a meter type. The wizard suggests kWh (electric energy) by default for columns named like kwh. Click + Add value stream to map additional value columns to the same meter.
Sample preview — A data preview at the bottom shows the first several rows so you can sanity-check the mapping.
Detected Meters — A summary at the bottom shows the meters that will be created, with row counts and date ranges.
Step 5 — Review
Section titled “Step 5 — Review”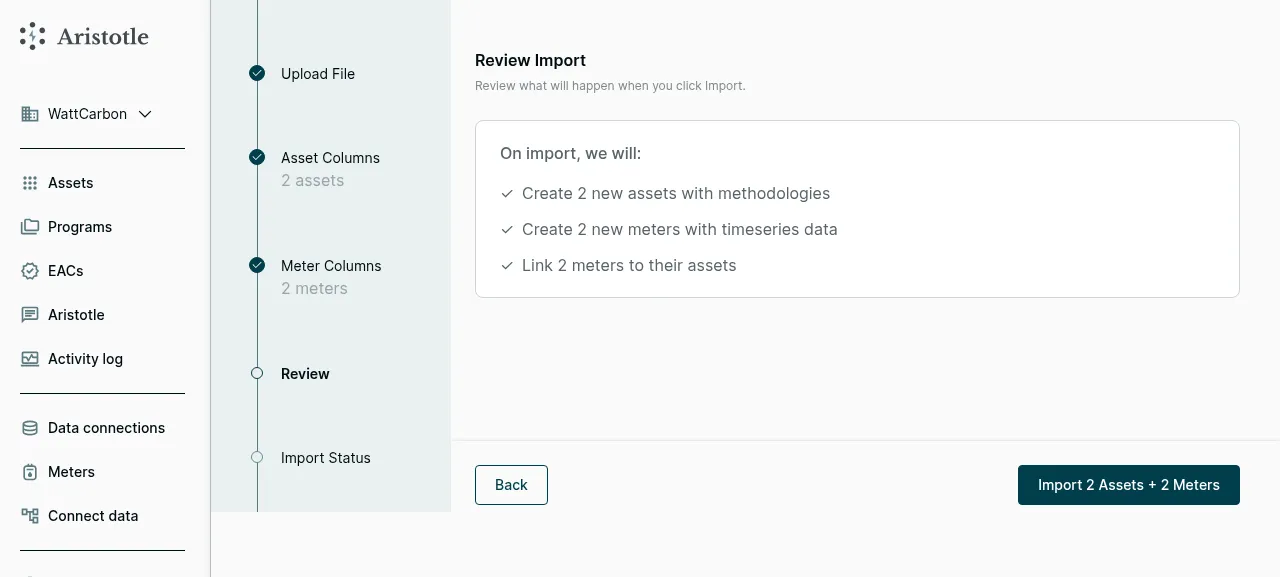
The review screen summarizes what the import will do:
- Number of assets to be created (with methodologies)
- Number of meters to be created (with timeseries data)
- Number of meter ↔ asset links to be made
Click Back to revise mappings. Click Import N Assets + N Meters to start.
Step 6 — Import status
Section titled “Step 6 — Import status”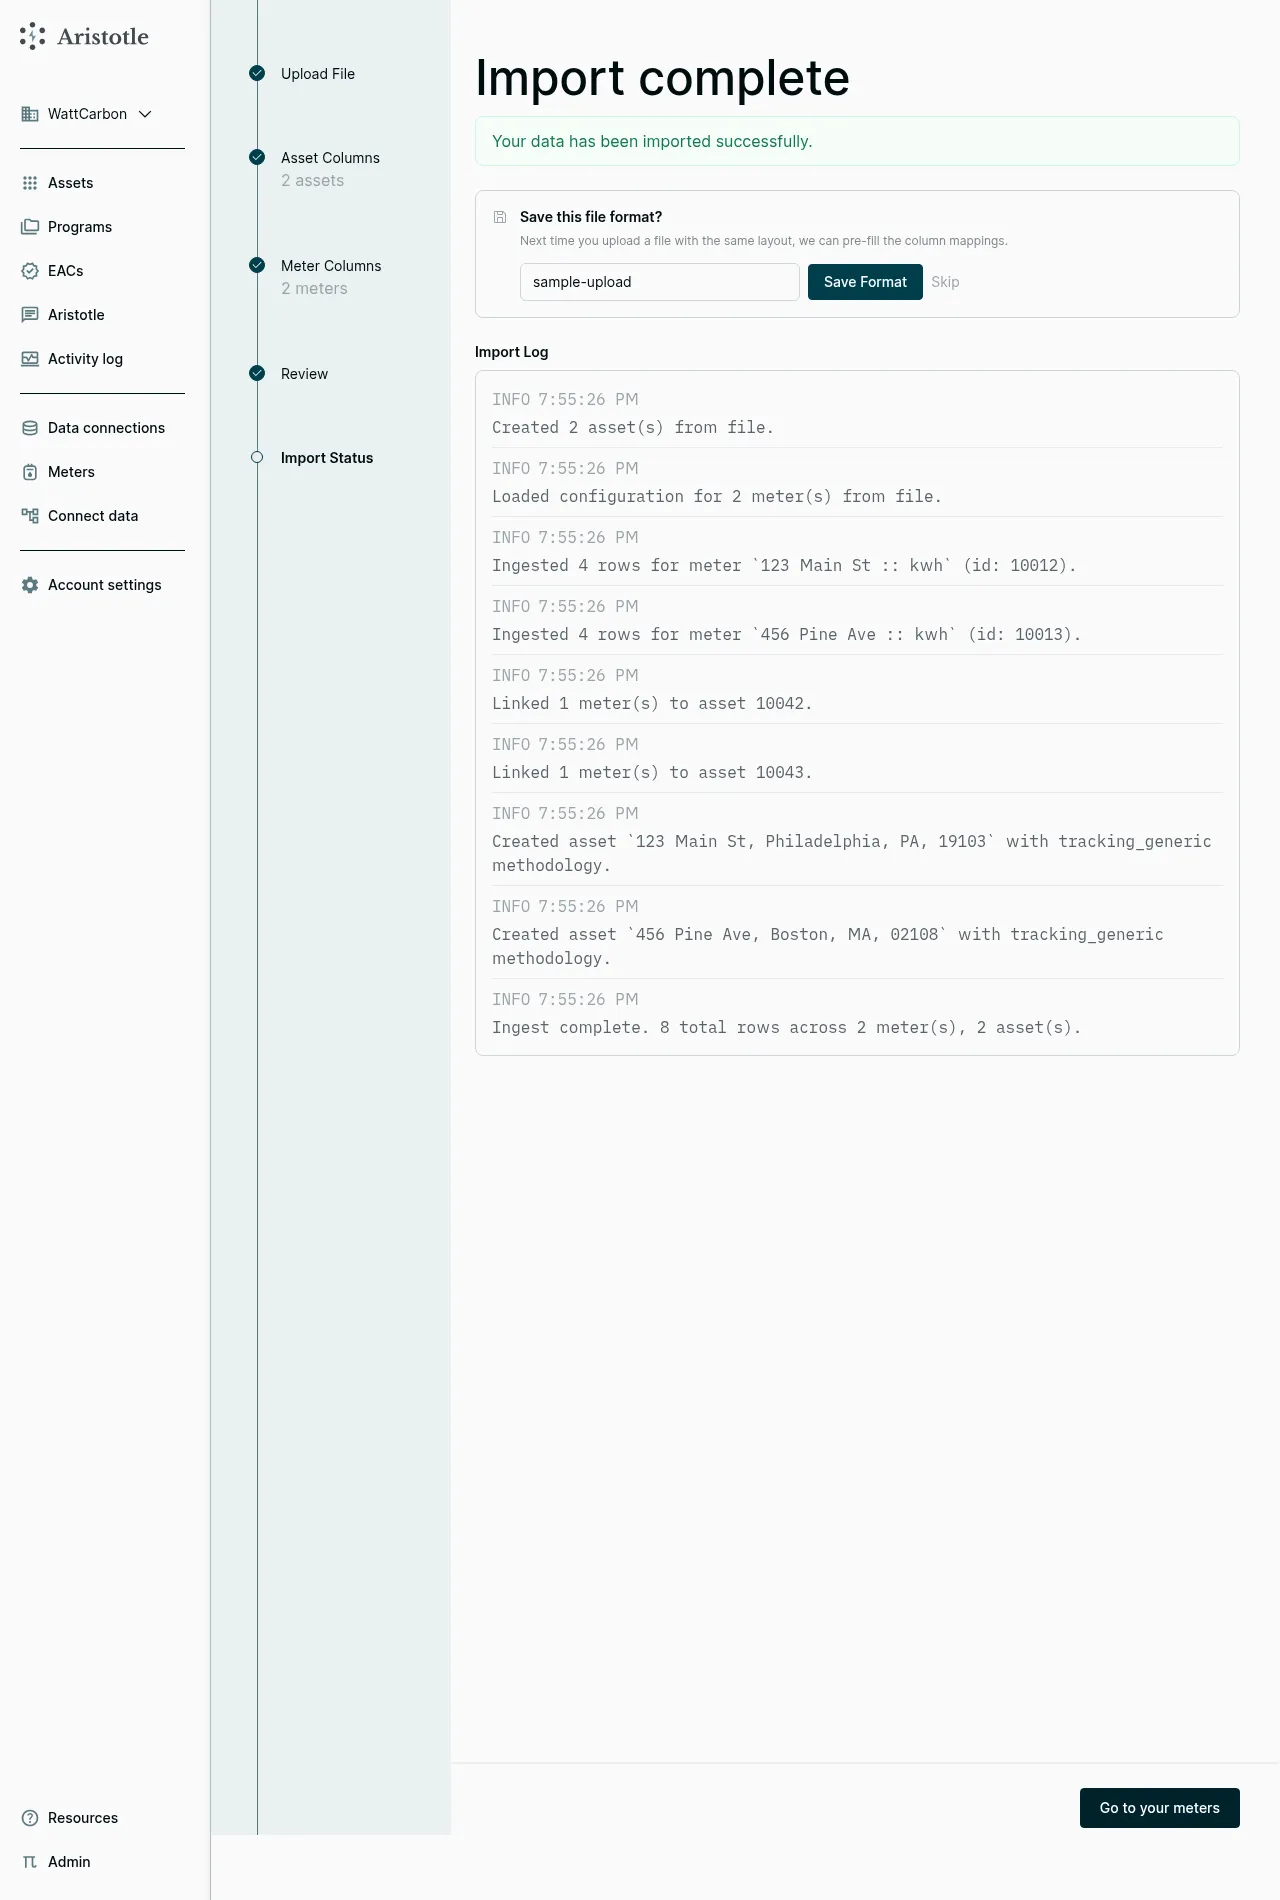
The import runs as a background job and streams a log to the page. When it finishes you’ll see “Your data has been imported successfully” with a per-meter, per-asset summary in the Import Log (e.g. “Ingested 4 rows for meter 123 Main St :: kwh”).
Save the format as a profile. If you’ll upload more files with the same layout — e.g. a recurring monthly export from the same source — name the format and click Save Format. Next time you upload a file with the same column structure, the wizard pre-fills the mappings. Click Skip if this was a one-off.
Click Go to your meters to view the new meters, or navigate to Assets to see the newly-created assets and confirm methodologies.
What gets created
Section titled “What gets created”For the example above (two addresses with four hourly readings each):
- 2 assets — one for each unique address, each with a Generic Tracking methodology
- 2 meters — one electric-energy meter per asset, holding the timeseries
- 2 meter↔asset links — each meter is linked to the asset at its address
After import, WattCarbon runs M&V on each asset’s methodology. Results appear on the asset detail page; once enough data is in place, EACs are minted on a regular cadence.
Step 7 — Configure methodologies (optional)
Section titled “Step 7 — Configure methodologies (optional)”The wizard auto-creates a methodology for each detected asset (defaulting to Generic Tracking when you didn’t pick another). You can review, edit, or add more methodologies from the asset’s Configure tab — useful when you want a richer M&V model than the wizard’s default, or want to track an asset under multiple methodologies side by side.
Open an asset from the Assets list, then click Configure in the lifecycle stepper at the top of the page.
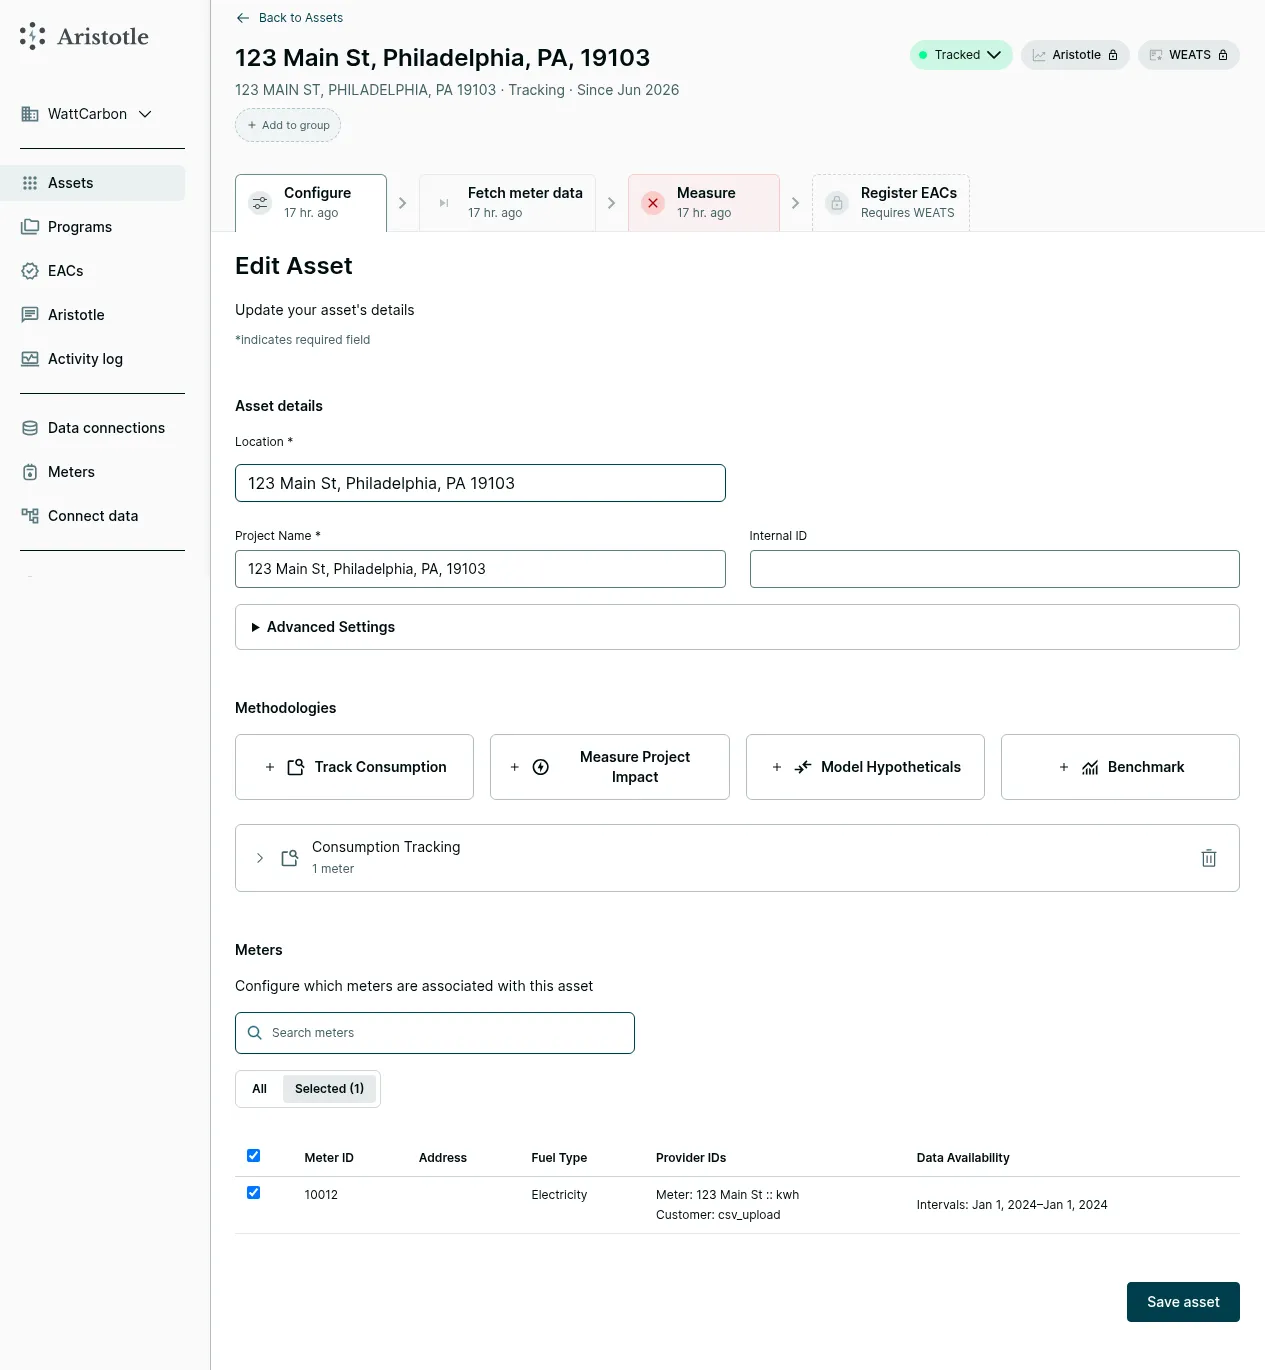
The Configure page has three sections:
- Asset details — edit Location, Project Name, and Internal ID. The location drives the weather data used for M&V.
- Methodologies — the asset’s methodologies, with four large buttons to add new ones grouped by intent: Track Consumption, Measure Project Impact, Model Hypotheticals, Benchmark.
- Meters — the meters linked to this asset.
Adding a Track Consumption methodology
Section titled “Adding a Track Consumption methodology”Click + Track Consumption to add a tracking methodology — the simplest kind, useful for monitoring raw consumption from interval data without a modeled baseline.
![]()
A new editable row appears with:
- Display Name — an optional custom label (otherwise the kind is used)
- Select meters — the meters that should feed this methodology. Defaults to all meters already on the asset; uncheck to exclude. If you need a meter that isn’t listed, the here link takes you to add one.
Click Add to save the new methodology, or Cancel to back out.
Other methodology intents
Section titled “Other methodology intents”The other three buttons add methodologies of different kinds:
- Measure Project Impact — adds an M&V methodology that builds a baseline model from the meter data and calculates savings against it. You’ll pick a specific kind (e.g. Directly Measured Solar, Building (EE + Electrification)) and provide any kind-specific fields (e.g. nameplate capacity for solar, building type / area / install dates for electrification).
- Model Hypotheticals — what-if analysis on observed meter data (e.g. fuel-switching scenarios).
- Benchmark — generates a deemed loadshape from asset criteria without meters — used for reference / benchmark methodologies.
The first methodology you add becomes the primary methodology and drives the asset’s top-level summary, grid and carbon scores, and EAC minting. Subsequent methodologies still produce their own measurement results.
Click Save asset at the bottom of the page to persist your changes. The asset will re-measure on the next scheduled run.
Part 2 — Onboarding via the API
Section titled “Part 2 — Onboarding via the API”The WattCarbon API is the right path for programmatic or recurring ingestion. The pattern is the same as the wizard, just expressed as HTTP calls: create meters with timeseries, create assets, attach methodologies.
Prerequisites
Section titled “Prerequisites”- API credentials —
EMAIL_ADDRESSandAPI_KEY. Find yourAPI_KEYunder Account Settings → API Key in the web app. There is one key per account; make sure you’re viewing the correct account (top-left account switcher) before grabbing it. - An HTTP client. The examples below use Python’s HTTPX library; any HTTP client works.
Step 0 — Get an access token
Section titled “Step 0 — Get an access token”Long-lived API keys are exchanged for short-lived (24-hour) access tokens used for all other requests.
import httpx
client = httpx.Client(base_url="https://api.wattcarbon.com")client.headers["User-Agent"] = "a unique name for your app"
token_response = client.post(    "/auth/token",    data={        "grant_type": "password",        "username": EMAIL_ADDRESS,        "password": API_KEY,    },)token_response.raise_for_status()client.headers["Authorization"] = "Bearer " + token_response.json()["access_token"]
See POST /auth/token for full details.
Step 1 — Create a meter
Section titled “Step 1 — Create a meter”A meter holds the energy timeseries. Use POST /meters with apiProvider: "manual" and meterType: "gas" or "electricity".
meter_response = client.post( "/meters", json={ "apiProvider": "manual", "meterType": "electricity", "location": { "street": "606 Ellis St", "city": "San Francisco", "state": "CA", "country": "US", "postalCode": "94109", }, },)meter_response.raise_for_status()meter_id = meter_response.json()["id"]The location field accepts either a structured object (as above), a free-text address, or {"latitude": ..., "longitude": ...}.
Step 2 — Upload meter timeseries
Section titled “Step 2 — Upload meter timeseries”Upload a CSV of meter readings to one of two endpoints depending on data granularity:
POST /meters/{id}/intervals— sub-hourly, hourly, or daily intervalsPOST /meters/{id}/bills— monthly billing data
Step 3 — Create an asset
Section titled “Step 3 — Create an asset”Once meters exist, create an asset using POST /accounts/{account_id}/assets:
asset_response = client.post( f"/accounts/{account_id}/assets", json={ "name": "My asset", "customId": "SP123", "location": "60 Greene St Riverside IA", "utility": "ABC Utility", "meterIds": [meter_id], },)asset_response.raise_for_status()asset_id = asset_response.json()["id"]locationis required on the asset (it’s what’s used for weather data, even if the meter has a location).customIdis optional but lets you enforce a unique identifier per site within your account.meterIdsattaches existing meters to the asset; meters can also be attached at the methodology level.
For bulk creation, use POST /accounts/{account_id}/assets/bulk with a CSV — contact support for the bulk schema.
Step 4 — Add a methodology
Section titled “Step 4 — Add a methodology”Methodologies are added separately so a single asset can carry multiple. Use POST /accounts/{account_id}/assets/{asset_id}/methodologies:
add_methodology_response = client.post( f"/accounts/{account_id}/assets/{asset_id}/methodologies", json={ "kind": "solar", "meterIds": [meter_id], "commencedOperationDate": "2022-08-01", "nameplateCapacityKw": 123, "inverterDataId": "1234", "inverterDataSource": "enphase", },)add_methodology_response.raise_for_status()The response includes the created methodology with its ordinal — a 0-based index indicating the methodology’s position on the asset. The first methodology added gets ordinal: 0, the second gets ordinal: 1, and so on. The ordinal is used to reference a specific methodology in subsequent API calls (e.g. removing a methodology or changing the primary):
{ "id": 456, "ordinal": 0, "kind": "solar", "createdTime": "2024-03-15T12:00:00Z", "meterIds": [999], "commencedOperationDate": "2022-08-01", "nameplateCapacityKw": 123, "inverterDataId": "1234", "inverterDataSource": "enphase"}The first methodology you add becomes the primary by default. The primary methodology drives the asset’s top-level summary, grid and carbon scores, and EAC minting. Non-primary methodologies still produce their own measurement results but don’t contribute to headline numbers.
Other methodology kinds take different fields — for example, building_eemetered (electrification) requires building characteristics and project install dates:
client.post( f"/accounts/{account_id}/assets/{asset_id}/methodologies", json={ "kind": "building_eemetered", "meterIds": [meter_id], "buildingType": "single_family_attached", "areaSqft": 1500, "yearBuilt": 1990, "numberOfStories": 2, "projectInstallStartDate": "2024-01-15", "projectInstallCompletionDate": "2024-03-01", "previousFuel": "gas", },).raise_for_status()Methodology kinds
Section titled “Methodology kinds”Methodology kinds fall into three categories:
- Tracking — Pass-through of metered data, no modeled baseline (e.g.
tracking_generic). - M&V — Metered methodologies that build a baseline and calculate savings against it (e.g.
solar,storage_direct,solar_storage,building_eemetered). - Reference — Compare actual performance against a reference standard (e.g.
building_reference,solar_reference).
Common kinds:
| Kind | Display name |
|---|---|
solar | Directly Measured Solar |
storage_direct | Storage |
solar_storage | Solar + Storage |
building_eemetered | Building (EE + Electrification) |
tracking_generic | Generic Tracking |
building_reference | Building Reference |
solar_reference | Solar Reference |
For the complete list and each kind’s required fields, see the API documentation. To pick a methodology, you can also use the methodology selector or contact support@wattcarbon.com.
Changing the primary methodology
Section titled “Changing the primary methodology”Use the batch operations endpoint to designate a different methodology as primary:
client.patch( f"/accounts/{account_id}/assets", json=[{ "op": "setPrimaryMethodology", "assetId": asset_id, "ordinal": 1, }],).raise_for_status()The ordinal is the 0-indexed position of the methodology on the asset. Changing the primary creates a new asset version internally, preserving audit history.
What happens next
Section titled “What happens next”Once assets, meters, and methodologies are in place, WattCarbon runs M&V on each methodology and computes hourly savings. Results land on the asset detail page in the web app. EACs are minted on a recurring cadence and either allocated to designated recipients or deposited into your account.
Questions?
Section titled “Questions?”Contact support@wattcarbon.com or check the FAQ.